Christchurch crane count climbs to 13 as civic jobs take over
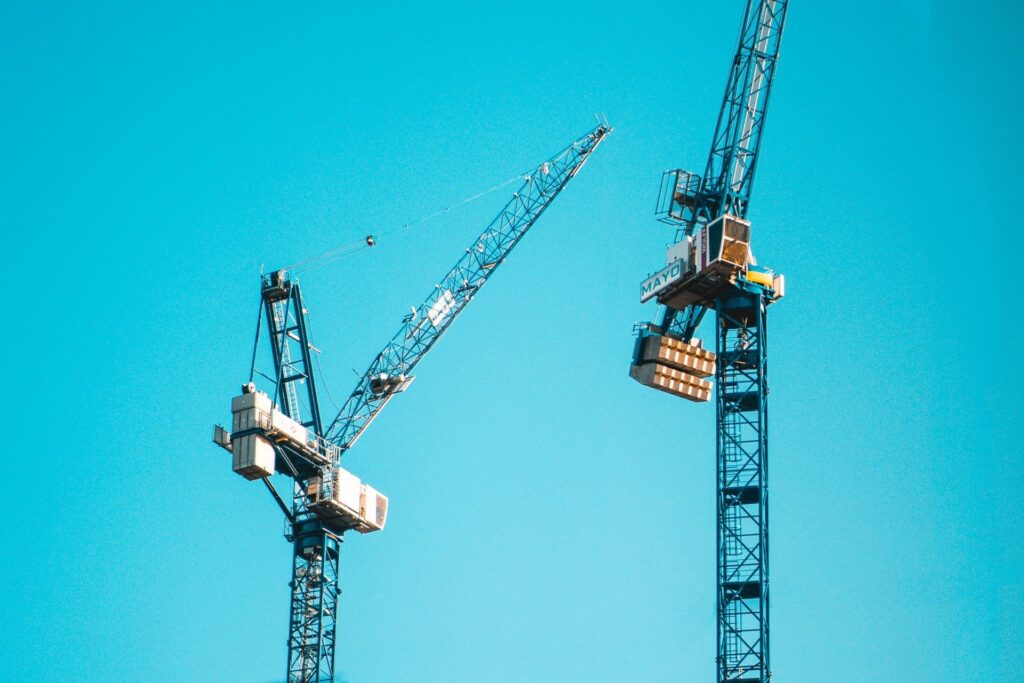
Christchurch has five more long-term cranes on its skyline than it had six months earlier. Rider Levett Bucknall’s (RLB) Q3 2026 Crane Index counted 13 in the city, up from eight in the Q1 2026 edition. Nine cranes went up on sites over the period and four came down.
RLB is a construction cost consultancy, and its staff physically count the fixed cranes on each centre’s skyline twice a year. Christchurch and Queenstown shared the biggest gains of the seven centres it tracks, each up five, while the national count rose from 102 to 106.
Christchurch’s 13 cranes put it third of the seven centres, behind Auckland’s 58 and Queenstown’s 16. It now holds 12.3% of the national count, up from 7.8% in Q1.
The city’s own index rose from 26 to 42 points. The index sets the Q3 2015 count at 100, so the city is still running well under half the cranes it had then.
Civic work carries the count
Seven of the 13 cranes are on civic projects, up from one in Q1. Grace Vineyard Church has three, the Canterbury Museum redevelopment has two, and Christchurch City Council’s wall cladding project has the other two. That’s more than half the city’s cranes on three sites.
Residential is the next biggest sector, with three cranes, up from two. RLB lists student accommodation on Oxford Terrace, a new accommodation development on St Asaph Street and The Poplars. The Oxford Terrace site lost one of its two cranes during the period.
The rest are single cranes. Forte Health has the city’s one health crane, and a hotel job RLB calls Project Ark is down from two cranes to one. RLB also counts one mixed-use crane at the corner of Cambridge and Hereford Street.
Two cranes came off the Waipapa Tower 3 project at Christchurch Hospital, and one left the Christchurch Casino. RLB counted no cranes in the city on civil, commercial, education, aged care or data centre work.
Life after Te Kaha
The rise follows a steep fall. In Q3 2025, RLB counted 23 long-term cranes in Christchurch, up from 19 in Q1 2025, and its index climbed from 61 to 74 points.
Ten of those cranes were on Te Kaha, the One New Zealand Stadium. RLB called the stadium the largest single concentration of cranes in the country at the time.
By the Q1 2026 count, all 10 stadium cranes had come down as the project neared completion. The city’s count dropped to eight and its index fell 65%, from 74 to 26 points. Four cranes went up that period and 19 came down.
That’s a swing from 23 to eight to 13 in the space of a year. The work is now spread over more, smaller sites, and no single Christchurch project has more than three cranes.
Consents point to more housing
Canterbury’s housing pipeline is the busiest in the country for its size. Stats NZ figures show 8,933 new dwellings consented in Canterbury in the year ended August 2026, up 35% on the 6,599 consented in the year ended August 2025.
That’s 12.8 new dwellings per 1,000 residents, the highest rate of any region and up from 9.5 a year earlier. The national rate was 7.7.
Bradley Coley, a director at RLB, says the recovery is still patchy across the country. “We believe the recovery is likely to remain uneven across regions and sectors, with the South Island outlook more promising,” he says.
Coley adds that changes in interest rates remain an important factor for construction activity. RLB also expects rising consent volumes to support activity over time.
For now, three civic jobs hold more than half of Christchurch’s cranes, and housing has three. RLB’s Q1 2027 count will show whether the Canterbury consent figures have started to turn into residential cranes in the city.